GoCompletions® 2015C Online Help
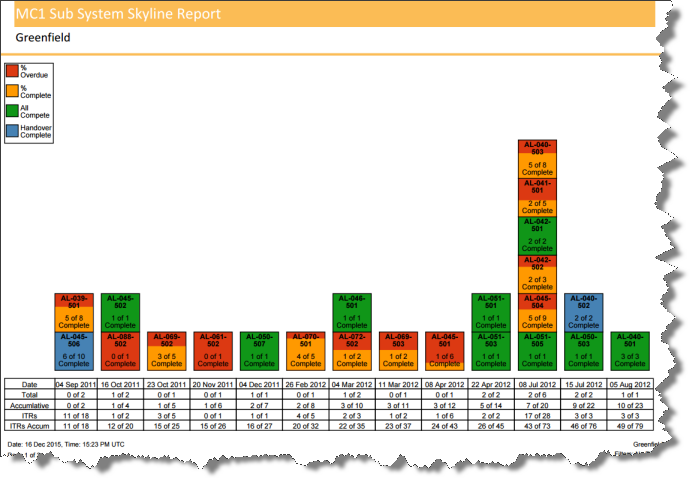
Skyline reports consist of square boxes stacked one of top of the other. Each box represents a planned item containing information about the item's progress. The boxes are stacked vertically for each planned date, while the dates are shown horizontally across the screen. A sample Skyline report in a Greenfield project looks like this:

As each box is progressed its colour changes showing the progress on the report.
The Planned Dates values on the horizontal axis are grouped into weeks, spanning from Monday to Sunday, with the date shown being the last day of the week (Sunday). Weeks will only appear along the axis if there are one or more items planned for that week.
The boxes are coloured starting from a full orange that indicates that none of the ITRs are completed, to a partial colouring, or a full completion or an overdue item with partial completion.
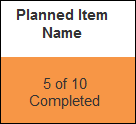
If 5 out of 10 ITRs are completed (50%) then the box is half filled with orange, with the orange filling from bottom to top:

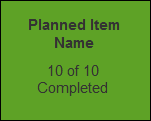
Once the item is 100% complete the box is fully filled, but with the colour changed to green:

Items which have planned dates in the past and are still not 100% complete are classed as overdue. Overdue items are shown in red, although if some progress has already been made the orange part of the Skyline is still shown:

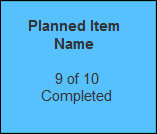
Skyline reports can also be linked to Handover Certificates, allowing you to show the progress of the Handovers on the Skyline Report. When an associated Handover is completed the Skyline box will change colour to blue. This will happen even if item is not 100% Completed:

If there are multiple items due on the same week, they are stacked one above the other. If we run out of vertical space on the page, a new stack is created next to the current one. To distinguish between a new stack on the same date and a new stack on a different date, a space is taken between stacks when changing to a different date.