GoCompletions® 2016A Online Help
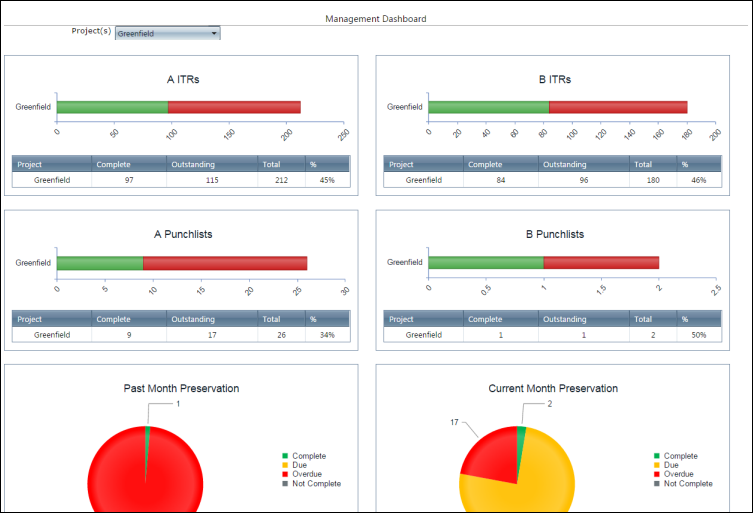
You can access the Management Dashboard page from the Report menu. It provides a quick graphical preview on the status of the project and outstanding ITRs and punch lists.

The Project (s) list shows all the projects to which the user has access. Green colour indicates the percentage of completed items whereas red indicates the percentage of outstanding items. This data is also presented as a table under the graph.
The Management Dashboard also shows the Preservation Count charts for the last, current and next month, depending on the calendar month. These charts are also present on the project Home page. They show the preservation status - complete, due, overdue, not complete.